This area demonstrates using examples how selected strategies from Dr. Samir's trading books can be used effectively to enhance trading results and boost profits
For more details on each application please refer to the specified chapter in the designated book. There you will find a detailed discussion of the logic behind each application, specific requirements, entry and exit strategies, defining characteristics as well as other important information.
Please note that the referenced chapters as well as the specific examples given will occasionally change.
Application 1
When to buy a stock after a significant drop
Book:" Explosive Stock Trading Strategies"
Chapter Title: "Trading Falling Knives"
EXAMPLE 1: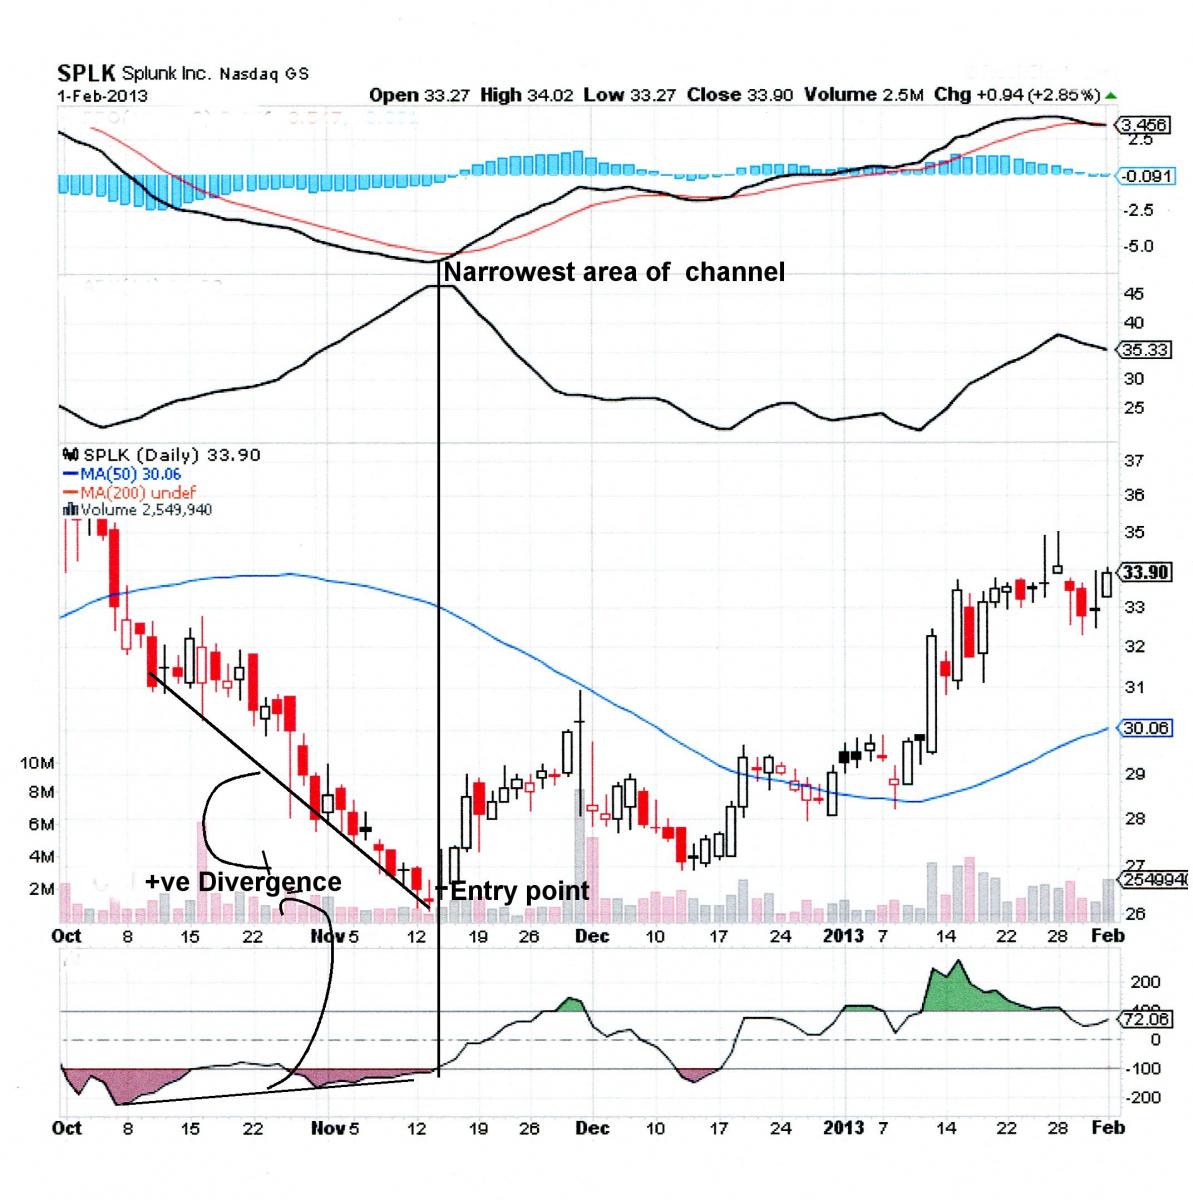
____________________________________________________________________________________________
Example 2: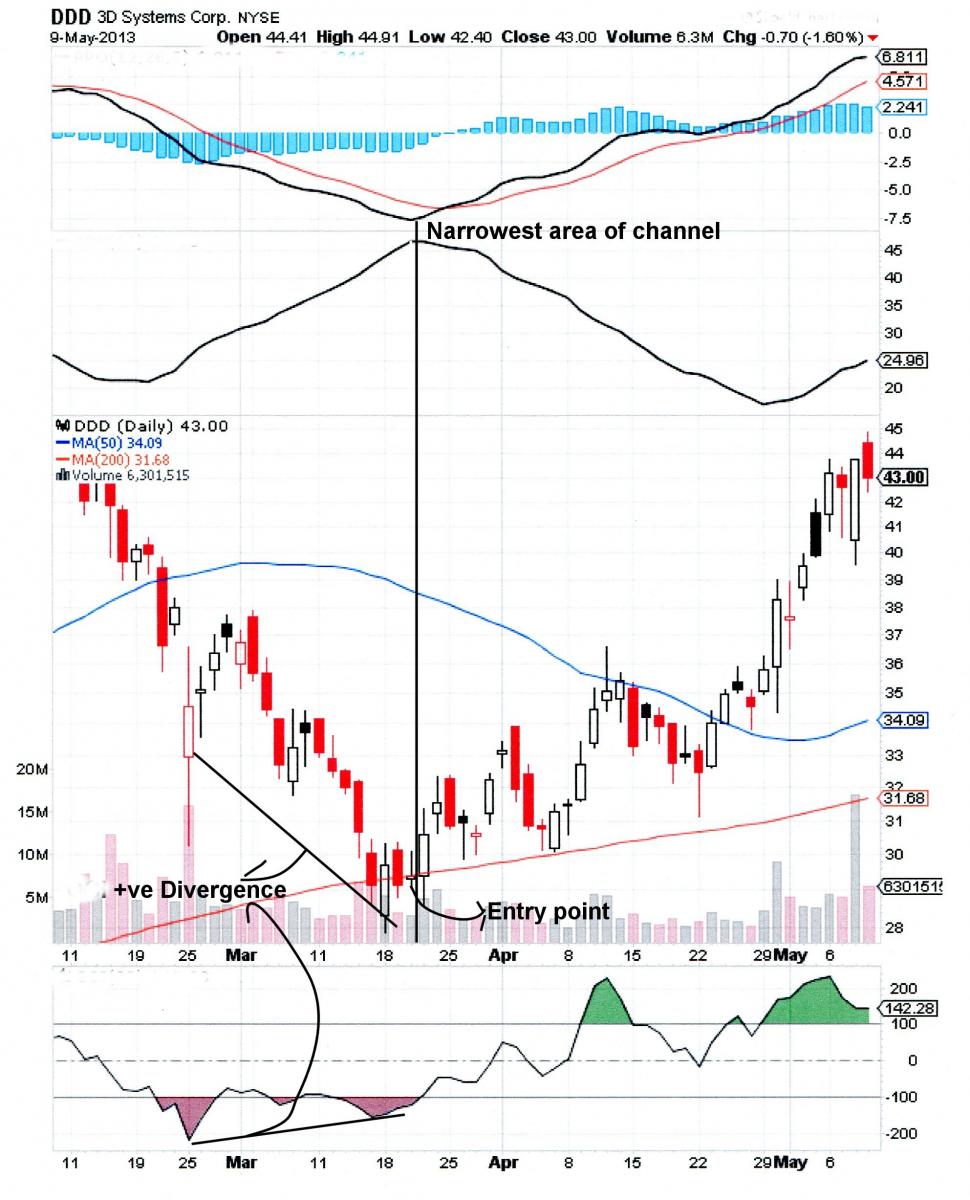
XXXXXXXXXXXXXXXXXXXXXXXXXXXXXXXXXXXXXXXXXXXXXXXXXXXXXXXXXXXXXXXXXXXXXXXXXXXXXXXXXXXXXXXXXXXXXXXXXX
Application 2
How to buy a stock just before a strong advance.
Book: "Generate Thousands in cash on your stocks before buying or selling them" Third Edition.
Chapter Title" Do this every week and never lose money in the market".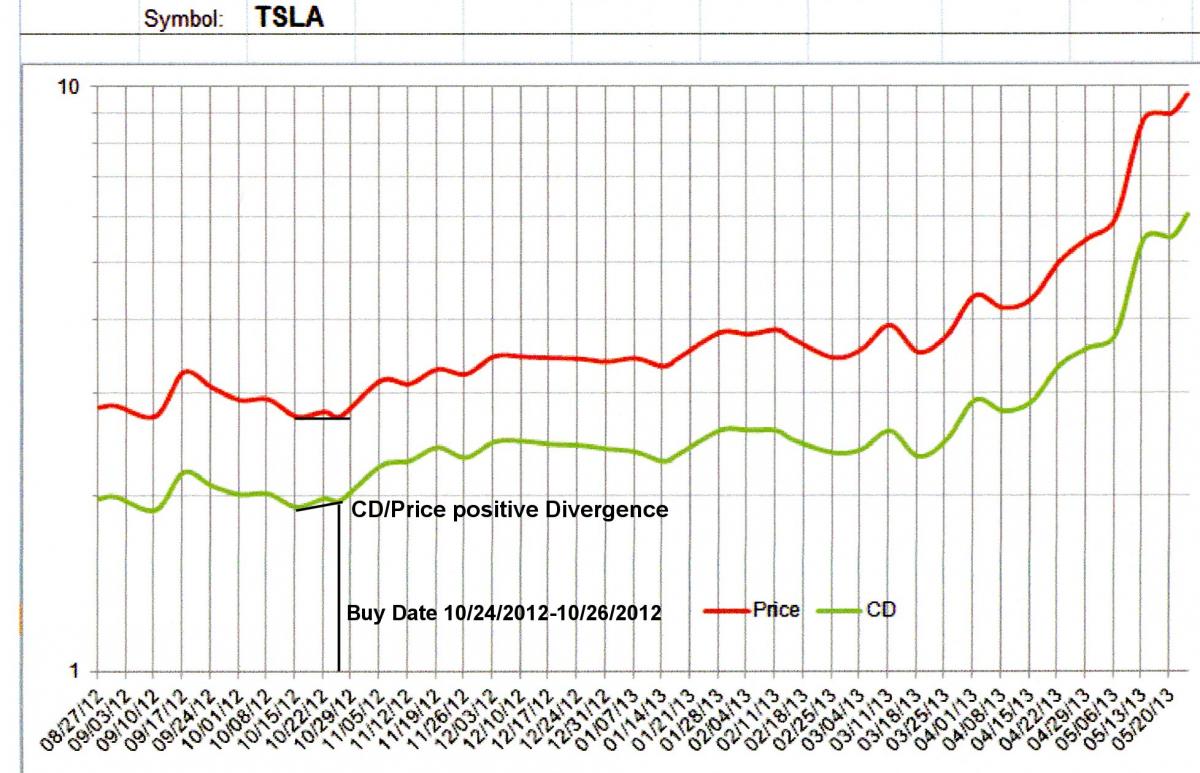
The chart below shows a blow up of the Positive CD/Price Divergence area . Notice trend line FLAT for price but UP for CD
TSLA Price chart below shows Position Entry area.
Notice that the stock traded within a range for almost two years prior this date . The C/D positive divergence buy signal was given just before a move to a new price level. As of May 20, 2013 no CD/Price Negative divergence sell signal (see first chart)was given riding the stock to near $100.
XXXXXXXXXXXXXXXXXXXXXXXXXXXXXXXXXXXXXXXXXXXXXXXXXXXXXXXXXXXXXXXXXXXXXXXXXXXXX
Application3
When To sell a long term hold
Book: "Generate Thousands in cash on your stocks before buying or selling them" Third Edition
Chapter Title" Do this every week and never lose money in the market"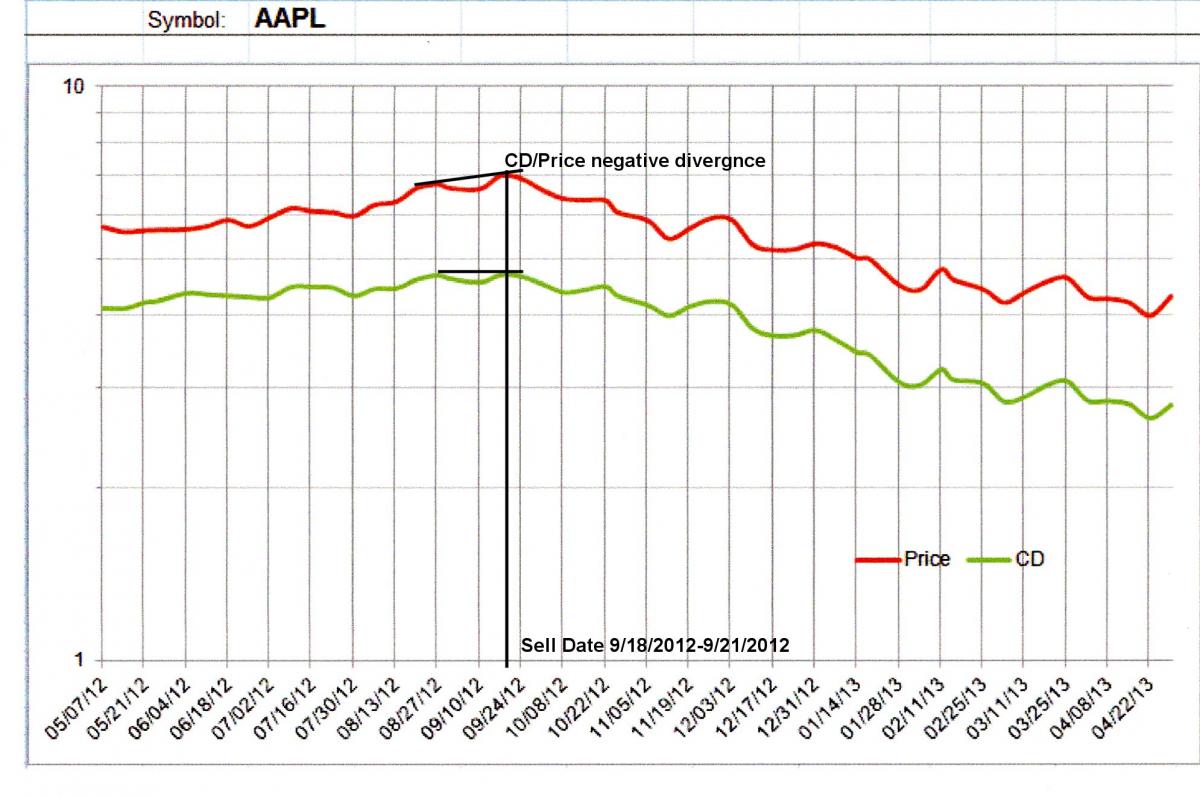
The chart below shows a blow up of the Negative CD/Price Divergence area . Notice trend line UP for price but flat for CD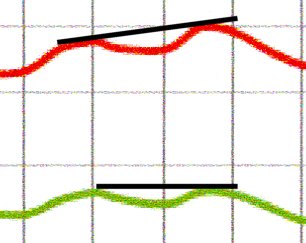
AAPL Price chart below shows exit area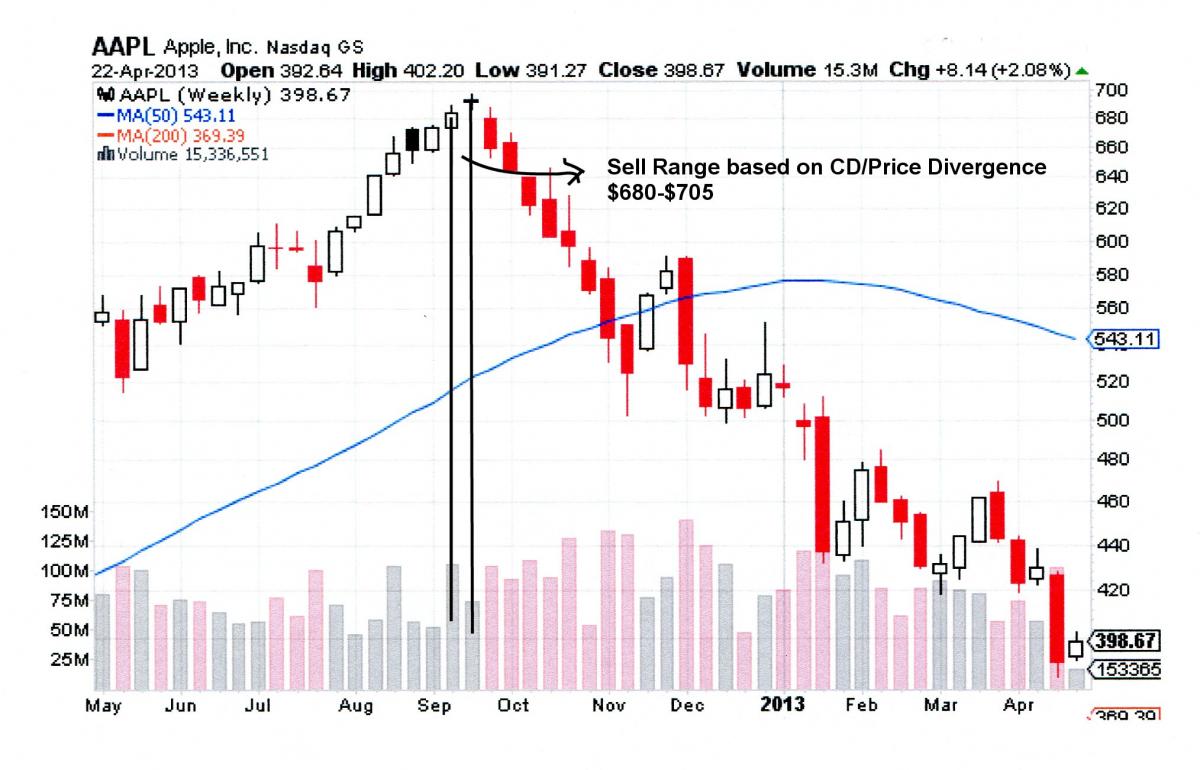
XXXXXXXXXXXXXXXXXXXXXXXXXXXXXXXXXXXXXXXXXXXXXXXXXXXXXXXXXXXXXXXXXXXXXXXXXXXXXXXXXXXXXXXXXXXXXXXXX