The method used here is an adaptation of the technique described in the book "Generate Thousands...." and used to time the sale of put and call options. In this artice I am offering a simple adaptation of this technique to time the entry into a stock before a major multi month uptrend. This is not meant for short term trading but rather for a holding period of several month possibly longer.
The Criteria used are as follows:
(1) Use weekly charts .
(2) Look for the line up of the weekly moving averages as follows SMA(10)> EMA(20)>EMA(30)
(3) Look for clear separation between the moving averages. Our goal is to cherry pick the best candidates out of the stocks returned in our scan
(4) Look for CMF value above 1.This indicates heavy accumulation as explained in the book "Generate thousands"
The NVDA chart below illustrates this method. Notice the entry point in Mid April 2016 where SMA10>EMA(20)>EMA(30) with good separatiion and
CMF >0.1. In 6 months the stock is now near $105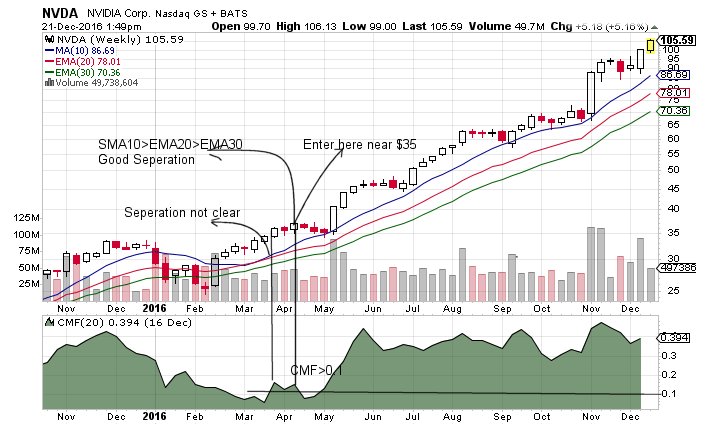
In the Example below on EXEL, the CMF>0.1 line intersects the moving averages while SMA(10)<EMA(20) which is still not the right entry point.
As you can see we had to wait until CMF is above 0.2 before the moving averages lined up correctly with separation. Our entry is near $7 in early June with
the stock above $16 we have over 100% profit.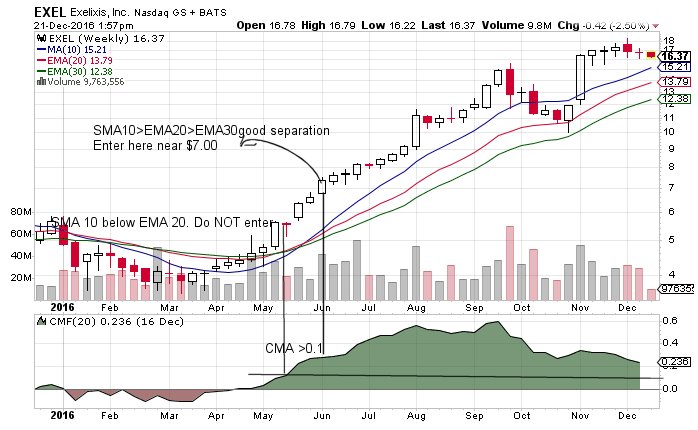
Both stocks still have the potential to advance further.
While there are many options to decide when to sell: for example the 10 day SMA crossing below the 20 day EMA, my preferred method which is likely
to alert you to a reversal within a few percent from the top is the method using Convergence /Divergence charts in chaopter 14 , page 187 in the book
"Generate Thousands.... ". You can see this illustrated in the example on page 214.