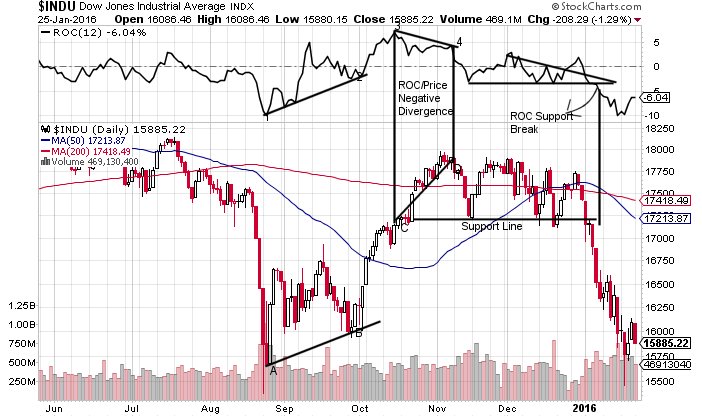
The market rallied after that drop but looking at the chart below (Refer to the book “Explosive Stock Trading Strategies “Chapter 5) we could clearly see that the strong comeback that occurred after that drop was not expected to last and that a retest of the August 24, 2015 lows is likely. Currently we are testing that area.

As you can see from the chart above there is a clear Momentum / Price Divergence between points C,D and 3,4 where the price moved higher at point D but the corresponding ROC value moved lower at point 4. The signal for a major pullback came as the ROC support line was breached at the same time the price support line was broken early 2016. The DOW dropped from above 17,200 to below 16,000 in a few days. Similar observations can also be made for the NASDAQ $COMPQ.
